The maple industry in Northern New York is a significant economic contributor to the local and state economy. Research prioritizd by the Northern New York Agricultural Development Program (NNYADP) has produced science-based, field-tested data to help the NNY regional maple industry grow from $3.25 million annually to now more than $20 million per year, and there is room yet to increase that economic value! Please see the links below to projects on maple and other trees that grow in the northern forest.
Attention has also been given to pollinator health: click here to read about the NNYADP project to improve beekeeper management practices to increase pollinator health and honey production in NNY.
THE LATEST MAPLE RESEARCH PROJECT RESULTS
2024: Cooling Maple Sap in a Warming Climate
Chilling Maple Sap Informational Bulletin (Nov 2025)
How to Build a Maple Sap Chiller (DIY Guide)
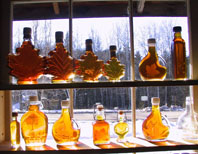
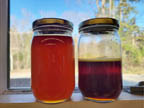
2024 report: Developing Alternative Tree Sap Beverages
Shrinking Maple Taphole Size to Increase Tree Health, 2023
NNYADP BEECH SYRUP RESEARCH RESULTS
Feasibility of American Beech Syrup Production, 2022 NNYADP Project Results
NNYADP BIRCH SYRUP RESEARCH RESULTS
. A Comparison of Sap Yields Per the Timing of Tapping Schedules for Birch (and Maple) Syrup Production
NNYADP MAPLE RESEARCH RESULTS
2023: Shrinking Maple Taphole Size to Increase Tree Health
2021: Solving the Dilemma: Alternative Maple Tubing That Prevents Clogging and Increases Production
Increasing Syrup Production by Re-Tapping Maples within the Sap Season (pdf) 2019-2020
Re-Tapping Maples Within the Sap Season for Increased Syrup Production 2019
Comparison of Sap Yields Per Timing of Tapping Schedules for Maple and Birch Syrup Production, Dec. 2018
January 2019: Growing Into NNY’s $10 Million Maple Industry Potential
2017: Evaluating 3/16″ Maple Sap Tubing Under Natural Flow and Artificial Vacuum
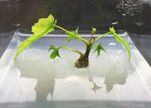 Cloning High Sugar “Sweet Trees,” 2017
Earlier Maple Research Results:
Increasing Sap Yields and Profitability in Maple Sugaring Operations Through Optimum Dropline/Spout Management, March 2014
. Figure 1: 2013 Sap Production at CCE St. Lawrence (key in main report)
. Figure 2: 2013 Sap Production at Uihlein Maple Forest
. Figure 3: 2011 Sap Production at Parker Maple
. Figure 4: 2012 Sap Production at Parker Maple.
. Figure 5: 2013 Sap Production at Parker Maple
. Table 1: 2011-2013 Systems at Parker Maple.
. Table 2: Sap Production and Economic Analyses for 7 NNY Sugarbushes 2011-2013
Maple Business Resources
. Cost-Benefit Analysis for Leasing Taps vs. Managing for Sawtimber Production, 2010
. Maple Business Revenue-Expense Summary Worksheet
Maple Net Present Value Calculator
Maple NPV Analysis of Leasing Taps vs. Saw Timber Production, 2010
Maple NPV Formula Descriptions
Maple Production
. Cooling Maple Sap in a Warming Climate
Chilling Maple Sap Informational Bulletin (Nov 2025)
How to Build a Maple Sap Chiller (DIY Guide)
Adapting to Climate Change in NNY Maple Production, 2008
Improving the Growth of Sugar Maples in NNY, 2007
Improving the Growth of Sugar Maples in NNY, 2006
NNY Maple Industry Potential for Growth
Survey of Northern Forest Landowners Re: Potential to Expand Maple Syrup Production, 2011
Growth Potential in the Northern NY Maple Industry
The Future of the Maple Sugar Industry in the United States: Assessing the Growth Potential Based on Ecological, Demographic and Public Policy Factors (Farrell)
Survey of NYS Landowners, 2009
Survey of NYS Maple Producers, 2009
Producer-Landowner Collaboration
Increasing NNY Maple Production through Effective Producer/Landowner Collaborations, NNYADP, 2009
Additional Maple Resources:
Cornell Cooperative Extension Associations of NNY
Cornell Maple Program